Every forecast is a claim about where the next batted ball lands. Diagram, not data.
A projection system is a claim, and a claim is only worth something once somebody writes it down before the season starts. That is the whole reason this site exists: to hold the forecasts in one place, at the same grain, on the same date, so that when the year is over there is something to check them against.
The awkward part is that nobody agrees on the scoreboard. One reader wants to know which system called the most home runs. Another cares only about playing time, because a forecast that misses the at-bats badly will miss everything downstream no matter how good the rate estimates were. A third is running a league and wants ranking order, not accuracy in any absolute sense. Those are three different questions and they routinely produce three different winners.
So the season indexes here do not crown anything. They list what each system published for hitters and for pitchers, in the plainest format the source made available, and they leave the scoring to whoever wants to do it. That sounds like a dodge. It is closer to an admission: the interesting work is in choosing the error measure, and handing you a pre-chosen one would quietly make that choice for you.
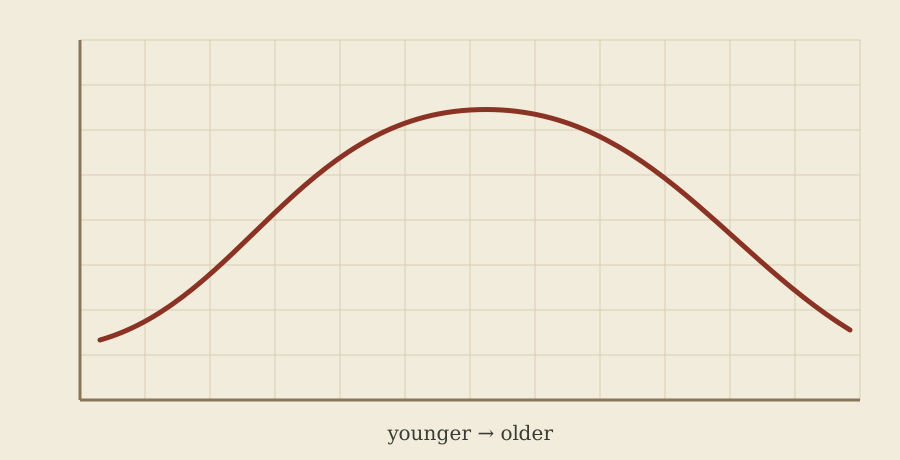
The shape nearly every forecast leans on, drawn without values so nothing is implied.
Underneath almost every system in these indexes is the same quiet assumption: players get better, then they get worse, and the turn happens somewhere in the middle. Draw that as a line and you get the shape above, which is the most reused idea in baseball forecasting and also the one most often misread.
The first misreading is treating the curve as a biography. It is not. It is an average built across many careers, and averages of careers are strange objects, because the players still in the league at the older ages are the ones who did not decline. Survivor effects flatten the right-hand side of the curve. Systems handle that differently, and the differences show up in exactly the places you would expect: veterans coming off a good year.
A submitted set is scored the same way a game is: written down first, checked later.
The point of collecting forecasts from amateurs alongside published systems is that the amateurs are frequently right, and almost never on the record. A spreadsheet built in February and never shared afterwards cannot be evaluated by anyone, including the person who built it.
A set worth filing has four properties. It covers a stated population, so that nobody has to guess whether the missing players were omitted deliberately or forgotten. It gives playing time as well as rates, because a rate without an opportunity estimate cannot be totalled. It uses one identifier consistently, so rows can be joined to outcomes without hand-matching names. And it carries the date it was fixed, which matters more than everything else on the list.
Comma separated columns: the least interesting format, and the one still readable years later.
The projection sets in this archive are distributed as comma separated text wherever the source allowed it, and the reason is dull enough that it is worth stating plainly: spreadsheets are documents, and these are tables.
A workbook carries formatting, formulas, hidden sheets, cached results and a version of the application that wrote it. Some of that is useful when a human is the reader. All of it is friction when the reader is a script totalling ten thousand rows across a dozen systems. Plain columns load the same way in every language anyone is likely to use, and they stay loadable long after the program that produced them has changed its file format twice.