Comparing projection systems without a scoreboard
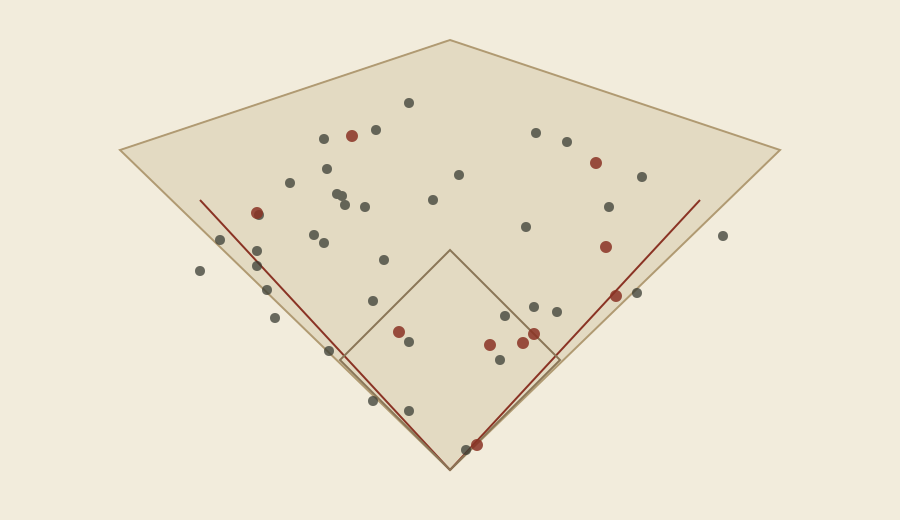
A projection system is a claim, and a claim is only worth something once somebody writes it down before the season starts. That is the whole reason this site exists: to hold the forecasts in one place, at the same grain, on the same date, so that when the year is over there is something to check them against.
The awkward part is that nobody agrees on the scoreboard. One reader wants to know which system called the most home runs. Another cares only about playing time, because a forecast that misses the at-bats badly will miss everything downstream no matter how good the rate estimates were. A third is running a league and wants ranking order, not accuracy in any absolute sense. Those are three different questions and they routinely produce three different winners.
So the season indexes here do not crown anything. They list what each system published for hitters and for pitchers, in the plainest format the source made available, and they leave the scoring to whoever wants to do it. That sounds like a dodge. It is closer to an admission: the interesting work is in choosing the error measure, and handing you a pre-chosen one would quietly make that choice for you.
What the collection does make easy is the side-by-side. Put the 2010 and 2011 indexes next to each other and the systems separate into rough families. Some are essentially weighted averages of recent seasons with an age adjustment. Some layer in minor-league translations. Some are aggregates of the others. Reading them together tells you more about where forecasting is hard than any single ranking ever will.
The seasons that stretch back to the start of the archive are thinner, and that is honest too. For most of those years only one continuous set survives, which is exactly why it is worth keeping.